PageSpeed Insights vs Lighthouse: why scores differ
PageSpeed Insights and Lighthouse share a testing engine. PageSpeed Insights runs Lighthouse remotely and also displays available Chrome User Experience Report (CrUX) field data. Lighthouse in Chrome DevTools runs a lab audit through your local browser. Their results can differ because the test environments, versions, and page states differ.
Before comparing scores, identify which part of each report you are reading. A Core Web Vitals assessment from real visits and a Lighthouse Performance score answer different questions.
Same engine, different measurement context
| Question | PageSpeed Insights | Lighthouse in Chrome DevTools |
|---|---|---|
| Where does the lab audit run? | Google’s remote infrastructure | Your local Chrome environment |
| What produces the Performance score? | A Lighthouse lab run | A Lighthouse lab run |
| Does it show CrUX field data? | When sufficient URL or origin data is available | The Lighthouse report itself does not |
| Can it audit a localhost page? | No; its servers need to reach the page | Yes, through your browser |
| What can you control? | Public URL and mobile/desktop selection | Mode, device profile, settings, and local page access |
DevTools also has a separate Performance panel that can show available field information. That does not turn a Lighthouse report into a field measurement. Google’s PageSpeed Insights overview explains its two data sources.
One public page, three sets of numbers
On October 22, 2026, I tested https://web.dev/ in PageSpeed Insights and local Chrome Lighthouse. This is a public reference page, not a customer project. No optimization was deployed between these observations.
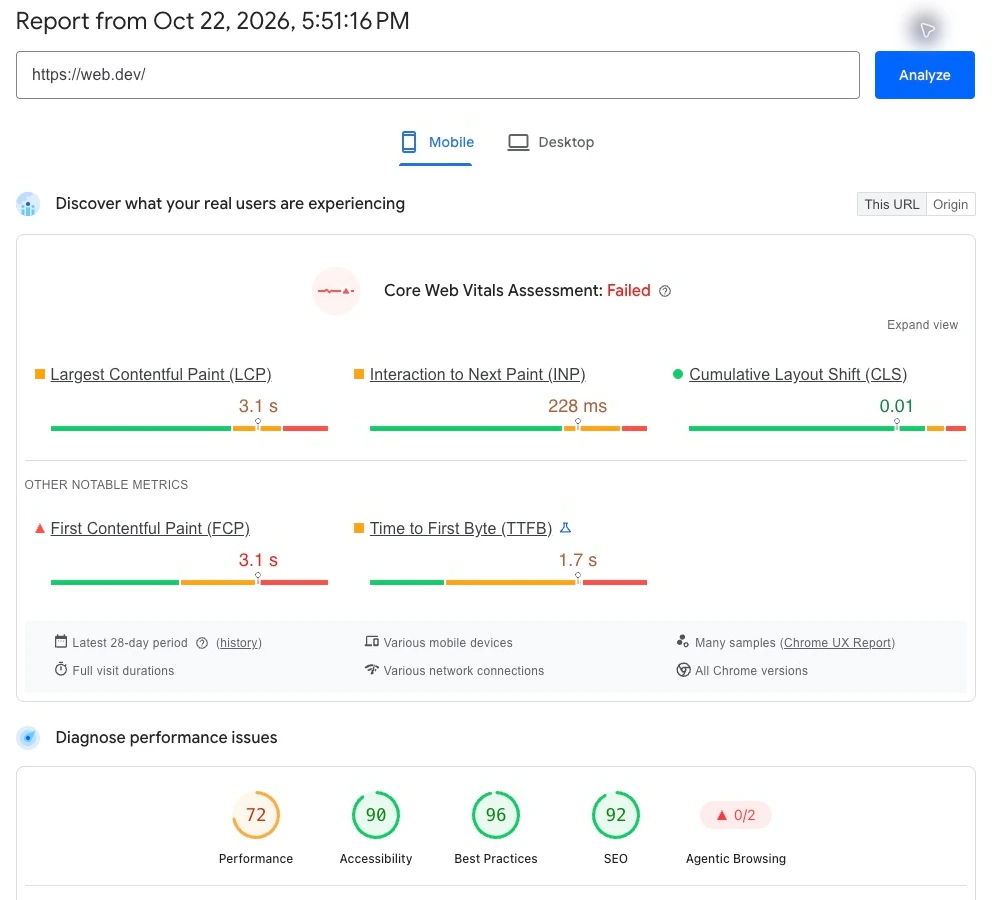
Mobile PageSpeed Insights report, October 22, 2026, 17:51 CEST. The upper section is field data for This URL; the lower section begins the lab report. Online reports may expire or change.
The upper section shows real-user LCP of 3.1 s, INP of 228 ms, and CLS of 0.01, with a failed Core Web Vitals assessment. These are field percentile values over the latest 28-day collection period, not the measurements from the lab run below.
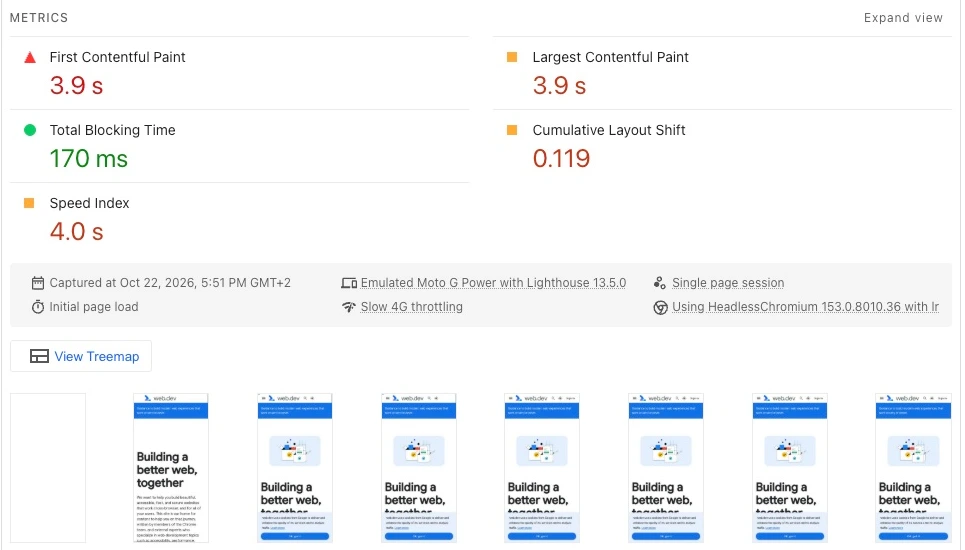
The same PSI report’s lab section: Lighthouse 13.5.0, emulated Moto G Power, Slow 4G, initial page load, HeadlessChromium 153.0.8010.36.
The local report produced a different result:
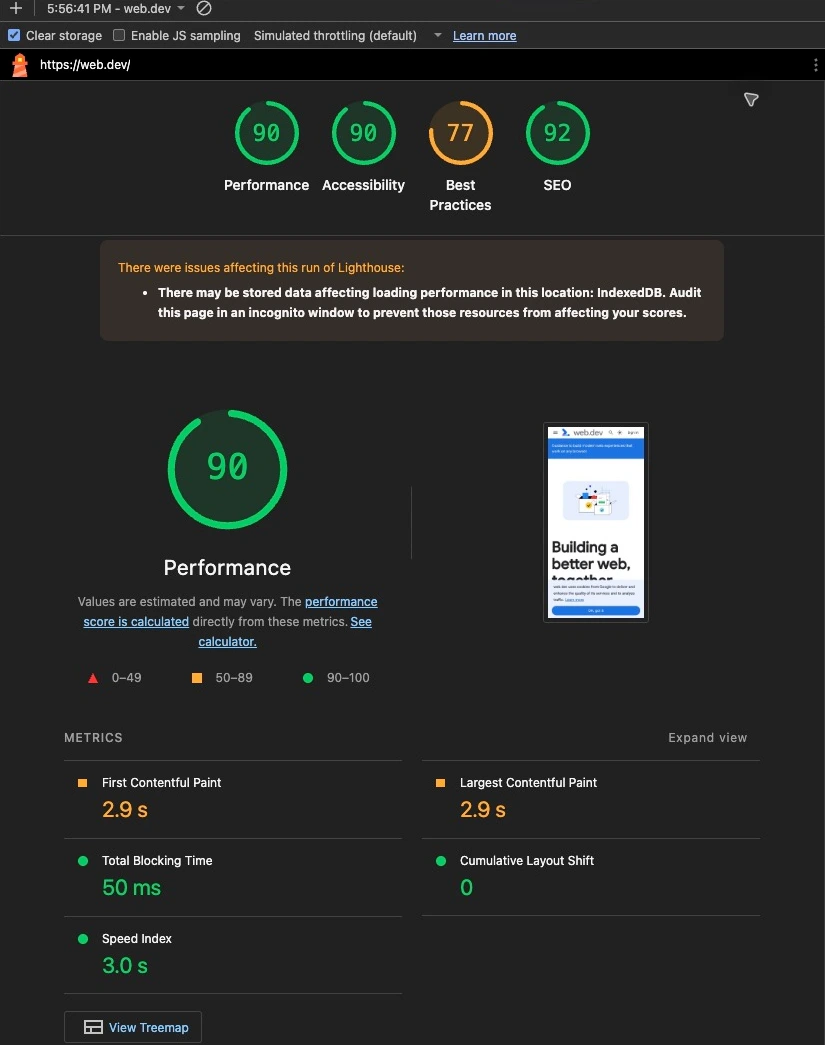
Local DevTools report, October 22, 2026, 17:56 CEST: Lighthouse 13.4.1, Chrome 155.0.0.0, mobile navigation audit with simulated Slow 4G and Clear storage selected. The report still warns that IndexedDB data may affect loading.
| Observation | Performance score | LCP | Responsiveness metric | CLS |
|---|---|---|---|---|
| PSI mobile lab run | 72 | 3.9 s | TBT 170 ms | 0.119 |
| Local mobile lab run | 90 | 2.9 s | TBT 50 ms | 0 |
| PSI mobile field data | Not a Lighthouse score | 3.1 s | INP 228 ms | 0.01 |
These are two individual lab observations and one field dataset, not a controlled benchmark. Lighthouse versions, execution environments, and storage conditions differ. The local warning is part of the evidence, not something to crop out. The 18-point difference does not prove an improvement or identify its cause.
Why the results can differ
Lab data and field data cover different visits
A lab run diagnoses one tested load. CrUX summarizes eligible real Chrome visits over a rolling collection period. Device mix, connections, geography, caches, and visitor behavior can differ from the lab scenario. If PSI lacks sufficient page data, it may show origin data; check the scope before treating it as this page’s result.
TBT and INP are also different metrics. A low lab TBT is useful diagnostic evidence, but it is not a field INP reading or a replacement for one. The guide to lab and field differences explains how these views complement each other.
“Mobile” does not make two environments identical
Local Lighthouse supports throttling and device emulation too. It does not simply measure an unrestricted desktop connection. Check the report’s actual settings: browser and Lighthouse versions, form factor, throttling method, and page-load mode.
Your local machine still performs work, and network routes and server responses can differ from Google’s infrastructure. Optional integrations and dynamic page content can add variation. A stronger computer is one possible influence, not a diagnosis derived from two scores.
Page state and storage matter
A signed-in page, a dismissed consent banner, or existing storage can change the work a page performs. In this example, Clear storage was selected, but Lighthouse explicitly warned about IndexedDB. For a clean comparison, use a consistent browser profile or an appropriate incognito session and inspect remaining warnings.
Avoid disabling scripts only when Lighthouse is detected. That would measure a different page from the one normal visitors receive. If an integration is optional, change its actual loading behavior for visitors and verify that its functionality still works.
Which tool should you use next?
Use PageSpeed Insights to inspect an accessible public URL, read available field data, and share a report. Its lab score remains a synthetic result; it is not automatically representative of every visitor.
Use local Lighthouse while investigating a change, a local build, or a page you can access through your browser. For development work, measure the production build rather than treating a development server as the deployed baseline. Use the Performance panel when you need to inspect the work behind a metric or reproduce an interaction.
For a regression after release, retain a consistent series of lab runs and compare field data separately as its collection window evolves. A fresh deploy does not immediately replace 28 days of real-user history.
A repeatable comparison checklist
- Use the same final URL, page content, and consent or login state.
- Compare mobile with mobile, and record the actual device and throttling settings.
- Keep Lighthouse and browser versions consistent where possible; record differences when they cannot match.
- Separate the Lighthouse score from field percentiles, URL data from origin data, and TBT from INP.
- Save warnings, the test time, and the environment together with the result.
- Run several comparable checks and inspect the range and median before calling a small change a regression.
- Trace the metric that changed, apply one relevant fix, and repeat the same procedure.
Run a free NEKTIQA speed test for Lighthouse diagnostics. Lighthouse monitoring and performance history help retain comparable lab observations over time. Those observations should be interpreted as lab data, not real-user INP or a CrUX assessment.
For a concrete layout problem, follow how to fix CLS. For image weight, libraries, and embedded widgets, see three practical website performance fixes.